2009 01 09Find your Garbage Collection leaks with Instruments
malloc and mmap memory that must be freed manually.
Instruments usually works great for finding leaks, but alas doesn't work under ObjC's garbage collection. We can however find a reasonable substitute in the ObjectAlloc instrument by approaching the problem differently :
- Display only Created and Still Living objects in ObjectAlloc
- Switch to Diagram View, listing all instances
- Open the call stack (Its button is just on the right of Diagram View)
- Run a piece of code multiple times and see which objects pile up :)
Run Instruments with Run→Start with Performance Tool→Object Allocations. After that, each Build and Go will launch the new build in Instruments.
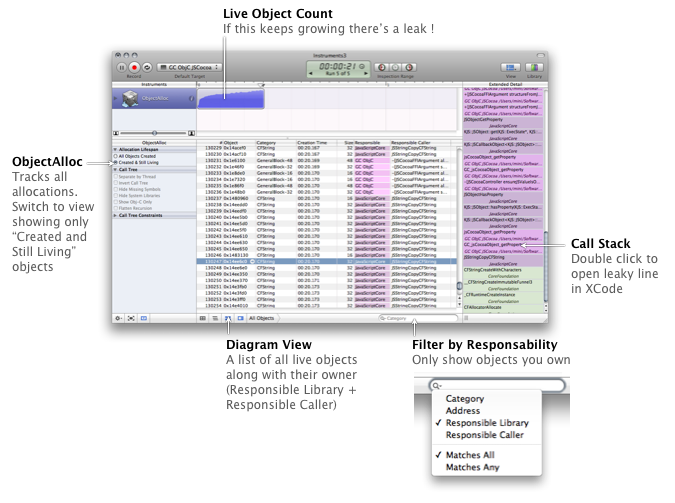
From there we can filter objects by responsability, that is showing only the objects from our app or from a specific lib. That was particularly useful to find both my leaks and a leak from my JavascriptCore usage. JSStringCopyCFString will create CFStrings that I usually cast to NSString then release — but this leaks as CFTypes must be CFReleased. Instruments pinpointed each instance of the problem. I could then double click the function call in the call stack, open the leaky code in XCode and fix it on the spot.
What changed in JSCocoa to enable it for GC :
- Finalize Added a
finalizemethod to do the cleanup usually done indealloc - NSMakeCollectable Tagged autoreleased
CFStrings withNSMakeCollectable. A function likeJSStringCopyCFStringreturns aCFStringand it must be released as such —releaseandautoreleasewill leak. The recommended Apple way to handle both GC and non-GC code is[NSMakeCollectable(myCFString) autorelease] - malloc_autorelease usage is gone :(
malloc_autoreleasedelegated the responsability to free memory to an autoreleasedNSDatainstance. The ObjC collector collected theNSDataearly thus trashing the memory used downstream ! - disable allocation for specific pointers After loading a BridgeSupport file, an adhoc parser gets a
char *pointer to[loadedDocument UTF8string]. The parser then advances the pointer to parse, changing it from its original value. Not finding a reference to the original pointer, the GC collects live memory.disableCollectorForPointerandenableCollectorForPointerwill protect/unprotect that pointer as long as you want.
Some Garbage Collection Resources
- Garbage Collection Programming Guide
- GC's environments variables
AUTO_LOG_ALLwill log every pointer registration and collection - Garbage Collection Pre-Processor Flag use
#ifdef __OBJC_GC__to check if GC is enabled